Here’s something that confuses the hell out of people when they’re learning Power BI: the difference between drill through and drill down. I’ve seen developers spend hours setting up the wrong one and then wondering why their users can’t navigate the data the way they expected.
Let me break this down in plain English and show you exactly when to use each one.
The Core Difference (Finally Explained Simply)
Drill-down = Going deeper into the same visual with more detail
Drill-through = Jumping to a completely different page with related details
Think of drill-down like zooming into a map—you’re seeing the same area but with more granular detail. Drill-through is like clicking on a building in that map and getting taken to a detailed floor plan on a separate page.
Drill-Down: Going Deeper in the Same Visual
How Drill-Down Actually Works
Drill-down uses hierarchies in your data. You start at a high level (like Year) and click to see the next level down (Quarter, then Month, then Day).
Here’s the setup process:
- Create your hierarchy in the data model:
- Right-click a field in the Fields pane
- Select “Create a hierarchy.”
- Drag related fields into the hierarchy in order (Year → Quarter → Month → Day)
- Add the hierarchy to your visual:
- Drag the entire hierarchy to your visual axis or category field
- Power BI automatically shows the top-level first
- Enable drill-down:
- Click the visual
- You’ll see drill-down icons appear in the top-right corner
- The down arrow enables drill-down mode
Drill-Down Controls You Need to Know
| Icon | What It Does | When to Use |
| ↓ | Turn on drill-down mode | Let users click data points to go deeper |
| ↑ | Drill back up one level | Show current and next level together |
| ⤋ | Go down one level for all data | Return to the previous hierarchy level |
| ⤴ | Expand all down one level | Show current + next level together |
Pro tip: Most users have no idea these icons exist. Add a text box explaining how to drill down, or just use the “Go to the next level” (⤋) button to show everything at once.
Real-World Example
Say you’re analyzing sales data:
- Level 1: Total sales by year
- Level 2: Click 2024 → See quarterly breakdown for 2024
- Level 3: Click Q3 → See monthly breakdown for Q3 2024
- Level 4: Click September → See the daily breakdown for September
The user stays in the same chart but gets progressively more detailed data.
Drill-Through: Jumping to Detail Pages
When to Use?
It is perfect when you need to show completely different information about the same data point. Like:
- Clicking a customer’s name to see their full profile and transaction history
- Clicking a product category to see individual product performance
- Clicking a sales region to see store-level details and maps
The Set-Up (The Right Way)
Here’s how to create a drill-through that actually works:
- Create your detail page:
- Add a new page to your report
- Build the detailed visuals you want to show
- Name the page something descriptive like “Customer Details.”
- Set up the field:
- On your detail page, go to the Filters pane
- Find the “Drill through” section at the bottom
- Drag the field you want to drill through (like Customer Name)
- Configure the source page:
- Go back to your summary page
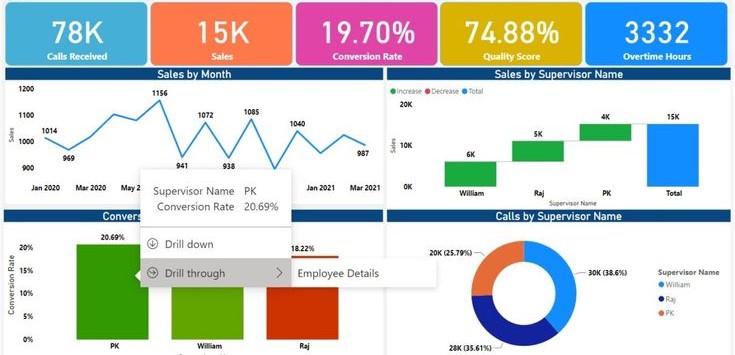
- Right-click on a data point in your visual
- You should see “Drill through” in the context menu
- Select your detail page
Making Drill-Through User-Friendly
Add a back button: Power BI creates one automatically, but you can customize it.
- Select the back button on your drill-through page
- Format it to match your design
- Position it somewhere obvious
Show context: Use card visuals on your drill-through page to remind users what they’re looking at:
Customer: [Customer Name]
Selected Period: [Date Range]
Region: [Region Name]
Cross-filtering: The drill-through automatically filters all visuals on the detail page – use this to your advantage.
Advanced Techniques That Actually Work
Multiple Drill-Through Fields
You can use multiple fields for drill-through. This is great for complex scenarios:
- Drill through on both Customer AND Product
- Drill through on Region AND period
- All fields must have values for the drill-through to work
Conditional Drill-Through
Sometimes you want drill-through to work only under certain conditions:
- Add measures to your drill-through filters
- Set conditions like “Sales Amount > 1000.”
- Users can only drill through on high-value transactions
Cross-Report Drill-Through
This is a newer feature that’s actually pretty cool:
- Set up drill-through to a page in a different report
- Perfect for jumping from summary dashboards to detailed analysis reports
- Requires both reports to be in the same workspace
Combining Drill-Down and Drill-Through
Here’s where it gets interesting—you can use both on the same page:
Example scenario: Sales dashboard
- Drill-down: Year → Quarter → Month for trend analysis
- Drill-through: Right-click any data point → Jump to detailed sales analysis page
This gives users two ways to explore: temporal drilling within the visual and contextual drilling to related details.
Performance Considerations
Drill-Down Performance
- Generally fast since it’s just changing the grouping level
- Can slow down with very large datasets
- Consider using aggregation tables for better performance
Drill-Through Performance
- Slower since it’s loading a new page
- The target page gets filtered data, which is usually faster
- Watch out for complex visuals on drill-through pages
Common Mistakes (And Quick Fixes)
Mistake 1: Confusing the Two
I see people trying to set up drill-down when they really want drill-through, or vice versa.
Fix:
Ask yourself, “Do I want to see more detail in the same chart or different information on a new page?”
Mistake 2: Too Many Hierarchy Levels
Creating 6+ level hierarchies that nobody will ever fully drill through.
Fix: Stick to 3-4 meaningful levels. Year → Quarter → Month is usually enough.
Mistake 3: No Visual Cues
Users don’t know if they can drill down or through because there are no hints.
Fix:
- Add instructional text
- Use consistent visual formatting
- Train users on the functionality
Mistake 4: Broken Drill-Through Context
Setting up drill-through, but the target page doesn’t make sense with the filtered data.
Fix: Always test your drill-through paths with real data to make sure the context makes sense.
Quick Setup Checklist
For Drill-Down:
- [ ] Hierarchy created and properly ordered
- [ ] Visual uses the hierarchy field
- [ ] Drill-down icons are visible
- [ ] All hierarchy levels have meaningful data
For Drill-Through:
- [ ] Detail page is built and formatted
- [ ] Drill-through field is added to the detail page filters
- [ ] Back button is positioned and styled
- [ ] Context cards show relevant information
- [ ] Cross-filtering works as expected
When to Use Which
Use drill-down when:
- You have natural hierarchies (time, geography, organization)
- Users need to see trends at different granularities
- You want to keep users in the same visual context
Use drill-through when:
- You need to show completely different metrics
- Users need a detailed analysis of specific data points
- You have space constraints on your main dashboard
The Bottom Line
Both drill-down and drill-through are powerful ways to let users explore data without overwhelming them with everything at once. The key is understanding what your users actually need to do with the data.
Start with the user’s workflow: Are they trying to understand trends at different periods (drill-down), or do they need to investigate specific outliers (drill-through)? Build from there, and you’ll create reports that people actually want to use.