Power BI bookmarks are like having multiple saved states of your report that you can switch between instantly. Think of them as snapshots of your report at different moments, with different filters applied, different visuals visible, or different data highlighted.
If you’ve ever wished you could save a particular view of your dashboard and jump back to it later, Power BI bookmarks are exactly what you need.
What bookmarks actually do
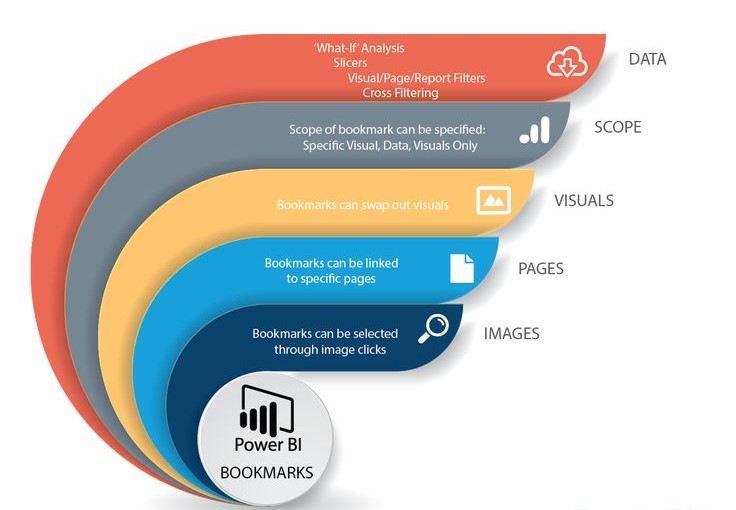
A Power BI bookmark captures and saves:
- Filter states: Which filters are applied and their values
- Visual visibility: Which charts and visuals are shown or hidden
- Slicer selections: Current selections in the dropdown menus and slicers
- Drill-down states: Whether you’ve drilled into specific data points
- Page navigation: Which page are you currently viewing
It’s like taking a screenshot, but instead of just the image, it remembers all the interactive settings too.
Real-world examples of Power BI bookmark magic
Scenario 1: Executive summary vs. detailed view. You have a sales dashboard with tons of detail. Create one bookmark showing just the key metrics (executive view) and another showing all the detailed charts (analyst view).
Scenario 2: Regional comparisons. Create separate bookmarks for each region—North, South, East, and West. Users can click buttons to instantly switch between regional views without manually changing filters.
Scenario 3: Time analysis. Set up bookmarks for “This Month,” “Last Month,” “Quarter,” and “Year” views. One click switches the entire dashboard to show data for that period.
Scenario 4: Storytelling. Guide users through a data story step by step. “Here’s the problem,” → “Here’s what we discovered,” → “Here’s the solution”—each bookmark reveals different aspects of your analysis.
How to create your first Power BI bookmark
Step 1: Set up your desired view
Before creating a Power BI bookmark, get your report looking exactly how you want it saved:
- Apply the filters you want
- Select the right values in the slicers
- Hide/show the visuals you want
- Navigate to the correct page
Step 2: Open the Bookmarks pane
In Power BI Desktop, go to the “View” ribbon and click on “Bookmarks pane.” A panel will appear on the right side of your screen.
Step 3: Add the bookmark
Click the “Add” button in the Bookmarks pane. Power BI will create a new bookmark with a default name like “Bookmark 1.”
Step 4: Rename your bookmark
Right-click on the bookmark and select “Rename.” Give it a descriptive name like “Q3 Sales Overview” or “Regional Comparison—North.”
Step 5: Test it out
Change some filters or settings in your report, then click on your bookmark. Everything should snap back to exactly how you saved it.
Advanced bookmark features
Data bookmarks vs. display bookmarks
Power BI gives you control over what gets saved:
Data bookmarks: Save filter states and slicer selections.
Display bookmarks: Save which visuals are visible/hidden
You can choose to save both or just one type, depending on what you need.
Spotlight feature
This is super cool—you can make a Power BI bookmark that highlights one specific visual while dimming everything else. Perfect for drawing attention to key insights during presentations.
Selected visuals only
Instead of bookmarking the entire page, you can bookmark just specific visuals. Select the visuals you want, then create the bookmark.
Creating Power BI bookmark navigation (the cool stuff)
Adding buttons for bookmark navigation
- Go to the Insert ribbon and click “Buttons.”
- Choose a button style (Back, Forward, or Blank)
- Select the button you just added
- In the Action settings, choose “Bookmark” and select which bookmark to link to
- Test by holding Ctrl and clicking the button
Creating a story flow
You can chain the Power BI bookmarks together to create a guided experience:
- “Next” buttons that move users through your analysis
- “Previous” buttons to go back
- “Home” button to return to the main view
- Topic-specific buttons for different sections
Power BI Bookmark best practices
Naming conventions that work
Use clear, descriptive names:
- ✅ “Sales by Region—North Focus”
- ✅ “Q3 Performance Summary”
- ✅ “Problem Analysis—Customer Churn”
- ❌ “Bookmark 1”
- ❌ “Test”
- ❌ “My bookmark”
Keep it organized
Group related bookmarks together and use consistent naming patterns. If you have regional bookmarks, name them “Region – North,” “Region – South,” etc.
Don’t go overboard
Too many Power BI bookmarks can be overwhelming. Start with 3-5 key views and add more only if they’re genuinely useful.
Test thoroughly
Always test your Power BI bookmarks after creating them. Change some settings, then click the bookmark to make sure it restores everything correctly.
Common Power BI bookmark use cases
Monthly reporting
Create bookmarks for different months so stakeholders can easily compare performance across periods without manually changing date filters.
Department dashboards
If your dashboard serves multiple departments, create bookmarks that filter data relevant to each team—Sales, Marketing, Finance, etc.
Presentation mode
Create a “clean” bookmark that hides filters and shows only the most important visuals for when you’re presenting to executives.
Drill-down tours
Guide users through increasingly detailed views of the data, from high-level overview to specific product performance to individual customer analysis.
Troubleshooting common Power BI bookmark issues
Problem: Bookmark doesn’t restore filters correctly.
Solution: Make sure you had “Data” selected when creating the bookmark. Recreate the bookmark if needed.
Problem: Visuals don’t hide/show as expected.
Solution: Check that “Display” was selected when creating the bookmark. Verify that the visuals you want to control are actually on the same page.
Problem: The button doesn’t navigate to the bookmark.
Solution: Check the button’s action settings. Make sure “Bookmark” is selected and the correct bookmark is chosen.
Problem: Bookmark breaks after report changes.
Solution: If you modify the report structure significantly, you might need to recreate affected bookmarks.
Power BI Bookmarks vs. Other Power BI Features
Bookmarks vs Buttons
Buttons are the UI element, and bookmarks are the saved states. You use buttons to trigger bookmarks.
Bookmarks vs Drill-through
Drill-through takes you to a different page with filtered data. Bookmarks change the current page’s appearance and filters.
Bookmarks vs Slicers
Slicers are interactive filters that users can change. Bookmarks can save specific slicer selections, but they’re different tools.
Performance considerations
Keep it lightweight: Bookmarks with complex filter combinations can slow down your report. Test performance with real data volumes.
Limit visual complexity: If your bookmark shows/hides many visuals, it might take longer to load.
Mobile considerations: Some bookmark interactions might not work perfectly on mobile devices. Test on different screen sizes.
Sharing bookmarks
When you publish your report to Power BI Service, bookmarks come along automatically. Users viewing your report online will see the same bookmark functionality.
Important note: Users can’t create their bookmarks in the Power BI Service—they can only use the ones you created in Desktop.
Creative Power BI bookmark ideas
Before/After comparisons: Show the same data with different periods or scenarios
Feature toggles: Let users show/hide advanced features or detailed information
Guided analysis: Create a step-by-step walkthrough of your insights
What-if scenarios: Show different business scenarios with different assumptions
Focus modes: Highlight different aspects of the same data for different audiences
Getting started with Power BI bookmarks
Start simple: Create one bookmark that shows a clean, focused view of your most important chart.
Add navigation: Create a button that users can click to return to this “home” view.
Expand gradually: Once you’re comfortable, add more bookmarks for different scenarios.
Get feedback: Ask users what different views would be helpful for their work.
Integration with other Power BI features
Selection pane: Use this to easily show/hide visuals when setting up bookmarks
Sync slicers: Bookmarks work great with synced slicers across multiple pages
Themes: Bookmarks can be combined with different themes for various presentation styles
The future of interactive reporting
Power BI bookmarks are part of a bigger trend toward interactive, user-driven analytics. Instead of static reports, we’re moving toward dynamic dashboards where users can explore data in guided ways.
In Nepal’s evolving tech landscape, organizations like NEST Nepal are fostering communities where data professionals share these kinds of advanced techniques. Learning to use features like bookmarks effectively can really set your reports apart from basic charts and tables.
Final thoughts
Power BI bookmarks might seem like a small feature, but they’re incredibly powerful for creating professional, interactive reports. They transform your dashboards from static displays into guided experiences that help users discover insights.
The key is thinking about your audience. What different views would be most helpful? What story are you trying to tell with your data? Bookmarks help you craft that narrative in a way that users can explore at their own pace.
Start with one simple bookmark today. Save a clean view of your most important dashboard, add a button to navigate to it, and see how it feels. Once you get the hang of it, you’ll find yourself using bookmarks in almost every report you create.
Remember: The best bookmark is one that saves someone time and helps them understand your data better. Keep that in mind, and you’ll create bookmarks that people use.