Introduction
“Do I use Excel or Power BI?”
It’s a question as old as modern spreadsheets, and in 2025, the answer is more nuanced than ever.
This in-depth guide will walk you through every angle: from raw number crunching to dashboards and advanced data modeling. Whether you’re a business analyst, a startup founder, a financial planner, or just trying to make sense of rows and columns, this blog is for you.
What Is Excel?
Microsoft Excel is the classic spreadsheet software that’s been the go-to for calculations, pivot tables, financial modeling, and data visualization since the 1980s. As of 2025, Excel has evolved into a highly capable analytical tool, but its roots remain in manual entry and cell-based workflows.
Key features:
- Spreadsheets with formulas and functions
- PivotTables and charts
- Add-ins like Power Query and Power Pivot
- VBA (Visual Basic for Applications)
- Strong for ad-hoc analysis and finance workflows
What Is Power BI?
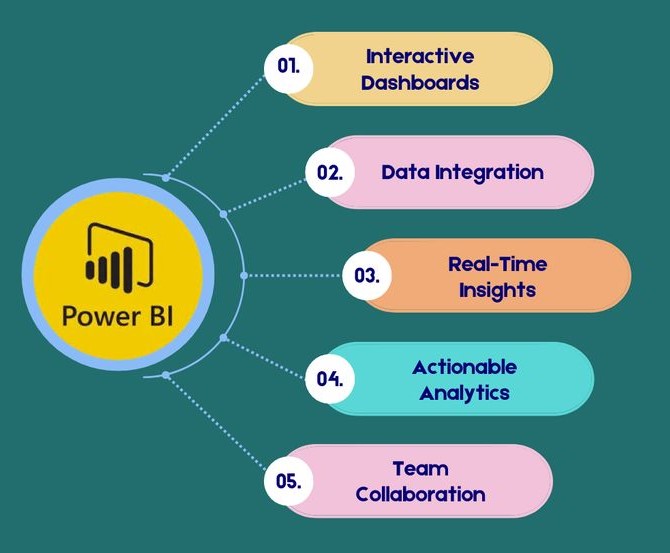
Microsoft’s Power Business Intelligence (BI) is one of the modern Business Intelligence platforms built for real-time data analysis, interactive dashboards, and automated reports.
It’s built from the ground up for scalable data modeling and visualization, which is perfect for making sense of big, live, and connected data.
Key features:
- Drag-and-drop dashboards
- DAX (Data Analysis Expressions) language
- Power Query editor for ETL
- Connect to hundreds of data sources
- Scheduled refresh and sharing
Core Differences at a Glance
| Feature | Excel | BI |
| Primary Use | Data entry, modeling | BI dashboards, reports |
| Learning Curve | Moderate | Steeper (especially DAX) |
| Visualization | Basic to advanced charts | Rich interactive visuals |
| Data Volumes | Medium (~1M rows) | Large datasets, millions of rows |
| Automation | Manual/macros | Scheduled refresh, dataflows |
| Sharing & Collaboration | Email / OneDrive | BI Service/apps |
| Price | Office 365 subscription | Free Desktop, Premium online tiers |
Data Analysis Power
Excel is known for its:
- Custom formulas
- Easy-to-use interface for small datasets
- PivotTables for quick summarizing
- Solver and Goal Seek for analysis
MS Business Intelligence steps it up with:
- DAX for powerful calculations
- Relationship modeling across datasets (like SQL joins)
- Measures and calculated columns
- Fast aggregation of large datasets
✅ Winner: Power BI (for advanced modeling); Excel (for small-scale ad-hoc analysis)
Data Visualization
Excel offers:
- Line, bar, scatter, radar, and combo charts
- Conditional formatting
- SparkLines
- Chart animations
BI delivers:
- Interactive dashboards
- Filters, slicers, drill-downs
- Map visualizations
- Real-time dashboards with streaming data
✅ Winner: Power BI, by a landslide for visuals, interactivity, and UX polish
Data Sources & Connectivity
Excel supports:
- Local files (CSV, XML)
- Cloud data via Power Query
- ODBC, SQL Server, and web APIs
BI expands on this:
- 100+ built-in connectors (Azure, Salesforce, MySQL, etc.)
- Cloud dataflows
- Real-time streaming APIs
✅ Winner: Power BI, especially for enterprise-grade connectors
Real-Time & Automation
- Excel: Manual refresh, unless you use VBA/macros or Power Automate
- BI: Scheduled refresh, row-level security, automatic alerts
✅ Winner: Power BI without any question
Collaboration & Sharing
Excel allows:
- File sharing via OneDrive or SharePoint
- Comments and track changes
BI enables:
- Publish to web, embed dashboards
- Role-based access control
- App workspaces and usage metrics
✅ Winner: Power BI for enterprise teamwork; Excel is easier for informal sharing
Use Cases: When to Use Each Tool
✔️ Use Excel when:
- You’re working with a familiar, lightweight tool
- You need to build quick models or calculations
- You need flexibility in formatting and formulas
- You’re doing heavy financial modeling
✔️ Use Power BI when:
- You’re working with live or big data
- You need to visualize and interact with dashboards
- You need robust analytics for teams or execs
- You’re distributing reports across your org
Performance & Scalability
BI handles:
- Millions of rows effortlessly
- Complex calculations across multiple tables
- In-memory data modeling with VertiPaq engine
- Excel starts to slow down with:
- More than ~500k–1M rows
- Complex formulas and macros
- Shared multi-user files
✅ Winner: Power BI. Much more scalable
Learning Curve & User Experience
- Excel is familiar and intuitive for most professionals
- Power BI has a steeper learning curve (especially DAX), but offers tutorials, community forums, and Microsoft Learn
✅ Winner: Excel for ease of use; Power BI for long-term ROI
Pricing & Licensing (In USD. Check out local Power BI plans with Nest Nepal)
- Excel: Included in Microsoft 365 (starts around $7/user/month)
- Power BI Desktop: Free (can be integrated with Microsoft 365)
- Power BI Pro: ~$10/user/month
- Power BI Premium: Enterprise level, $20–$100+/user/month
Winner: Excel for affordability at small scale; Power BI for advanced org-level use
So, is Power BI better than Excel?
Our best suggestion is to combine Excel’s flexibility with Power BI’s power to become unstoppable. Did you know BI and Excel complement each other beautifully?
- You can export BI reports to Excel
- Use Excel workbooks as data sources in BI
- Analyze Power BI datasets in Excel using pivot tables
Think of Excel as your sandbox, and BI as your delivery engine.
Conclusion
| Excel is for… | BI is for… |
| Quick reports | Dashboards & KPIs |
| Small to mid-sized datasets | Big, connected, live data |
| Finance & modeling | Analytics, storytelling, insights |
| Tactical daily tasks | Strategic, scalable decision-making |
✅ Verdict:
If you’re serious about data-driven decisions, BI is your long-term ally.
But if flexibility and day-to-day analysis matter most, Excel still earns its keep.
Get Started with Both Tools:
Try Power BI Desktop for free
Microsoft Learn for Excel