If you’re still wrestling with complex Excel spreadsheets for your data analysis and reporting needs, it’s time to have an honest conversation about why Power BI might be the upgrade your workflow desperately needs. Power BI vs. Excel is a major debate in this age of data science and analytics. Don’t get me wrong → Excel is fantastic for what it was designed to do, but when it comes to modern business intelligence and data visualization, Power BI takes things to a completely different level.
Power BI vs. Excel: The Data Volume Reality Check
Let’s start with the elephant in the room: data volume. Excel starts choking when you hit around a million rows, and if you’ve ever tried to work with large datasets in Excel, you know the pain of waiting for calculations to complete or dealing with crashes when your file gets too big.
Power BI handles millions of rows without breaking a sweat. The VertiPaq engine compresses data efficiently and processes calculations in memory, meaning you can work with datasets that would bring Excel to its knees. I’ve seen organizations move from multiple Excel files with thousands of rows each to single Power BI models handling tens of millions of records with better performance.
Power BI vs. Excel: Real-Time Data vs Static Snapshots
Excel is fundamentally built around static data. Sure, you can set up data connections and refreshes, but it’s clunky and often unreliable. You end up with multiple versions of files floating around, and nobody’s quite sure which one contains the latest data.
Power BI was designed from the ground up for live data connections. Your reports automatically refresh based on schedules you define, and everyone always sees the same, current data. No more email chains asking, “Which version of the sales report should I be looking at?” The data governance alone makes Power BI worth the switch for most organizations.
Power BI vs. Excel: Visualization Capabilities That Actually Make Sense
Excel’s charting capabilities haven’t evolved much beyond basic bar charts and line graphs. Creating compelling visualizations requires significant manual work, and customization options are limited. The result? Most Excel charts look like they’re from 2005.
Power BI comes with modern, interactive visualizations out of the box. Maps that actually work well, responsive charts that users can filter and explore, and visual types that are designed for business intelligence rather than academic presentations. The visual marketplace extends capabilities even further, giving you access to specialized charts that would be impossible to create in Excel.
Power BI vs. Excel: Data Modeling vs Spreadsheet Chaos
Excel’s approach to data relationships is fundamentally flawed for serious analysis. VLOOKUP functions become unwieldy, pivot tables have limitations, and maintaining relationships between multiple data sources is a nightmare. You end up with fragile formulas that break when someone adds a row or column in the wrong place.
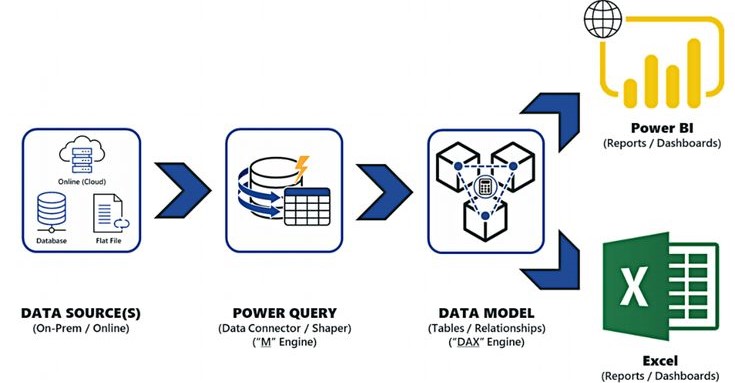
Power BI’s data modeling capabilities are purpose-built for relational data analysis. You can create proper relationships between tables, define calculated columns and measures using DAX, and build robust data models that don’t fall apart when your underlying data changes. The Power Query engine handles data transformation in a way that’s both more powerful and more maintainable than Excel’s approach.
Power BI vs. Excel? Or A Collaboration That Actually Works
Excel collaboration is still fundamentally broken. Yes, Office 365 improved things with co-authoring, but try having multiple people work on complex Excel models simultaneously. Version conflicts, performance issues, and overwriting each other’s work are constant problems.
Power BI was built for collaborative analytics. Multiple people can build reports from the same dataset without conflicts. Sharing is straightforward → no more emailing massive Excel files or dealing with broken links. Comments, subscriptions, and workspace organization make team collaboration actually functional rather than frustrating.
Power BI Vs. Excel: Performance and Responsiveness
Anyone who’s worked with large Excel files knows the frustration of waiting for recalculations or dealing with sluggish performance. Complex pivot tables can take forever to refresh, and adding new data often means rebuilding significant portions of your analysis.
Power BI’s in-memory engine processes calculations efficiently, and the user experience remains responsive even with complex reports. Interactive filtering and drill-down capabilities work smoothly, encouraging data exploration rather than discouraging it through poor performance.
Power BI vs. Excel: Mobile and Web Access
Excel on mobile devices is functional for basic tasks, but viewing and interacting with complex reports is painful. Desktop Excel remains the primary interface, which limits accessibility for remote teams or executives who need quick access to key metrics.
Power BI reports are designed to work well across devices. The mobile apps provide genuine functionality rather than just document viewing, and web access means stakeholders can access reports from anywhere without needing specific software installed.
Power BI vs. Excel: Automated Insights vs Manual Analysis
Excel requires manual analysis for everything. You build formulas, create charts, and interpret results through manual processes. While this gives you control, it’s time-consuming and prone to human error.
Power BI includes automated insights features that can identify trends, anomalies, and patterns in your data without manual intervention. Features like Quick Insights, Key Influencers, and Decomposition Trees help surface findings that might be missed in manual analysis. You still control the final interpretation, but the tool helps guide your analysis.
Power BI vs. Excel: Scalability and Enterprise Features
Excel doesn’t scale well organizationally. Individual files become silos, version control is manual, and sharing complex models across teams is problematic. Security is limited to file-level permissions, and audit trails are nonexistent.
Power BI provides enterprise-grade features like row-level security, comprehensive audit logs, centralized data governance, and scalable sharing through workspaces and apps. These capabilities matter when your analytics solution needs to support dozens or hundreds of users rather than just individual analysts.
Power BI vs. Excel: Data Source Connectivity
Excel’s data connection capabilities are limited and often unreliable. Connecting to modern data sources like cloud APIs, streaming data, or big data platforms requires workarounds or additional tools.
Power BI includes native connectors for hundreds of data sources, with robust support for both cloud and on-premises systems. The data refresh capabilities are reliable and can be scheduled and monitored centrally.
Power BI vs. Excel: When Excel Still Makes Sense
Excel isn’t obsolete → it’s still excellent for ad-hoc calculations, financial modeling, and situations where you need the flexibility of a spreadsheet interface. For quick analysis, one-off calculations, or when you need the computational flexibility that only spreadsheets provide, Excel remains the right tool.
But for regular reporting, dashboard creation, team collaboration on data analysis, or any scenario involving significant data volumes, Power BI provides a better experience and more robust capabilities.
Power BI vs. Excel: Making the Transition
The biggest barrier to moving from Excel to Power BI is often familiarity. Excel feels comfortable because most people have used it for years. However, the learning curve for Power BI is less steep than you might expect, especially if you’re already comfortable with Excel’s pivot tables and basic charting.
Start with simple reports that replicate existing Excel dashboards. Focus on connecting to your data sources and creating basic visualizations. As you become comfortable with Power BI’s interface and capabilities, you’ll discover analytical possibilities that weren’t feasible in Excel.
The productivity gains and improved insights typically justify the transition effort within a few months. Your future self will thank you for making the switch before your Excel-based processes become even more complex and unwieldy.
Power BI isn’t just a better version of Excel’s charting capabilities → it’s a fundamentally different approach to working with data that’s designed for modern business intelligence needs. The question isn’t whether Power BI is better than Excel for data analysis; it’s whether you’re ready to upgrade your analytical capabilities to match your organization’s data reality.