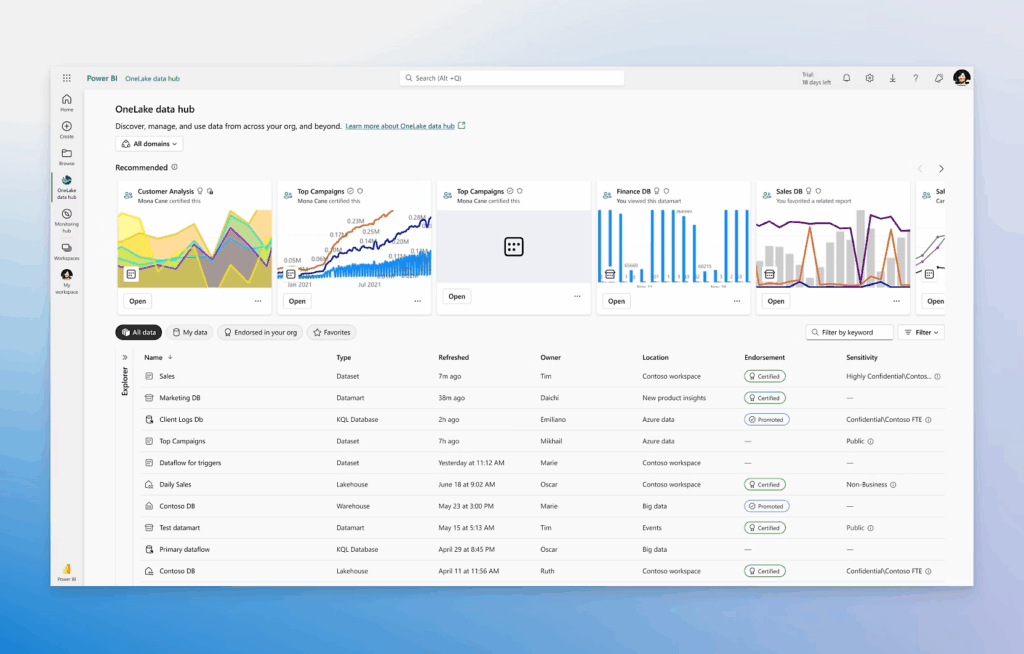
Okay, let’s clear up the confusion right away. When people say “Power BI,” they’re actually talking about two different things, and mixing them up is probably the #1 source of frustration for beginners.
Think of it like this: Power BI Desktop is like Microsoft Word (you build stuff), and Power BI Service is like SharePoint Online (you share and collaborate). Both are important, but they do completely different jobs.
The simple breakdown
Power BI Desktop = Your workshop

- Free Windows application that you install on your computer
- Where you build reports, connect to data, and create visualizations
- Works offline
- Heavy lifting happens here
Power BI Service = Your showroom
- Web-based platform (powerbi.com)
- Where you publish, share, and collaborate on reports
- Requires an internet connection
- Where others view your work
Power BI Desktop: The detail view
What it’s actually for
Power BI Desktop is your report creation tool. This is where you’ll spend most of your time when you’re building dashboards and reports.
Key features you’ll use daily:
Data connection and modeling:
- Connect to Excel, databases, web services, basically anything
- Clean and transform your data with Power Query
- Create relationships between different data sources
- Build calculated columns and measures using DAX
Report building:
- Drag and drop to create charts, tables, and maps
- Design custom layouts and themes
- Add slicers, filters, and interactive elements
- Test everything before sharing
Advanced stuff:
- Custom visuals from the marketplace
- Complex data modeling with multiple tables
- Advanced DAX calculations
- Performance optimization
When to use Desktop:
- Building new reports from scratch
- Major report modifications
- Data modeling and relationship setup
- Testing new visualizations
- Working with large datasets that need local processing
What you CAN’T do in Desktop:
- Share reports with others (you need the Service for this)
- Set up automatic data refreshes
- Create workspaces or manage permissions
- Access reports from mobile devices
- Collaborate in real time.
Power BI Service: The detail view

What it’s actually for
Power BI Service is your collaboration and sharing platform. Once you’ve built something cool in Desktop, this is where it comes to life for your team.
Key features you’ll use daily:
Sharing and collaboration:
- Publish reports from the Desktop to the service.
- Create and manage workspaces
- Share dashboards with specific people or groups
- Set up row-level security for sensitive data
Data management:
- Schedule automatic data refreshes
- Monitor refresh status and failures
- Manage data gateway connections
- Set up alerts and subscriptions
Consumption features:
- View reports in a web browser
- Create quick dashboards by pinning visuals
- Export data to Excel or PDF
- Access from mobile apps
When to use Service:
- Sharing completed reports with your team
- Setting up automated data refreshes
- Creating dashboards from multiple reports
- Managing who can see what data
- Viewing reports on mobile or tablet
- Setting up data alerts and subscriptions
What you CAN’T do in Service:
- Create complex reports from scratch (limited editing)
- Connect to on-premises data sources directly
- Advanced data modeling
- Install custom visuals
- Work offline
The typical workflow (how they work together)
Here’s how most people actually use both tools in real life:
Step 1: Build in Desktop
- Open Power BI Desktop
- Connect to your data sources
- Clean and model your data
- Create reports and visualizations
- Test everything locally
Step 2: Publish to Service
- Click “Publish” on the Desktop
- Choose which workspace to publish to
- Desktop uploads your report to the Service
Step 3: Share and manage in Service
- Set up data refresh schedules
- Create dashboards by pinning key visuals
- Share with team members
- Monitor usage and performance
Step 4: Iterate (back to Desktop)
- Make changes in Desktop
- Republish to Service
- Changes automatically update for all users
Quick comparison table
| Feature | Desktop | Service | Winner |
| Report creation | Full featured | Basic editing only | Desktop |
| Data modeling | Advanced | View only | Desktop |
| Full-featured | Can’t share | Built for sharing | Service |
| Mobile access | No | Yes | Service |
| Offline work | Yes | No | Desktop |
| Collaboration | No | Yes | Service |
| Data refresh | Manual only | Automatic scheduling | Service |
| Cost | Free | Requires Pro license | Desktop |
Common beginner mistakes (and how to avoid them)
Mistake 1: Trying to build complex reports in Service. The Service web editor is basic. Build in Desktop, then publish.
Mistake 2: Not understanding the publishing process. When you publish from Desktop, it creates a new copy in Service. Changes in Desktop don’t automatically appear in Service until you republish.
Mistake 3: Forgetting about data refresh. Your Service reports won’t update automatically unless you set up refresh schedules.
Mistake 4: Sharing Desktop files directly. Don’t email .pbix files around. Publish to Service and share links instead.
Licensing: What you need to know
Power BI Desktop: Completely free. Download and use as much as you want.
Power BI Service: Has different tiers:
- Free: Can publish your own reports, but very limited sharing
- Pro: $10/month per user, needed for most business scenarios
- Premium: For large organizations, pricing varies
Reality check: If you want to share reports with colleagues, you’ll need Pro licenses for everyone involved.
Which one should you start with?
If you’re just learning, start with Desktop. It’s free, works offline, and you can experiment without worrying about licenses or sharing.
If you need to share reports, you’ll need both. Desktop to build, Service to share.
If you’re in a small team, everyone needs Desktop to build reports, plus Pro licenses to share through Service.
If you’re in a large organization, talk to your IT team about Premium capacity and enterprise deployment.
Mobile and web apps: Where do they fit?

Power BI Mobile Apps: These connect to the Service, not Desktop. Think of them as viewers for reports published to Service.
Power BI Web App: This IS the Service. When you go to powerbi.com, you’re using the Service.
Real-world scenarios
Scenario 1: Personal analysis. Use Desktop only. Connect to your data, build reports, and analyze locally. No need for Service.
Scenario 2: Team dashboard. Build in Desktop, publish to Service, and share workspace with the team. Set up auto-refresh so everyone sees the current data.
Scenario 3: Executive reporting. Build in Desktop, publish to Service, create clean dashboards in Service, and share with executives who only need to view.
Scenario 4: Department-wide analytics. Multiple people building reports in Desktop and publishing to a shared Service workspace, with different permission levels for different roles.
Tips for a smooth Desktop-Service workflow
Keep file organization clean:
- Use consistent naming for reports
- Organize Desktop files in logical folders
- Use descriptive workspace names in Service
Plan your data refresh strategy:
- Know where your data comes from
- Understand refresh limitations (8 times per day for Pro)
- Set up data gateways for on-premises sources
Test before publishing:
- Verify all visuals work in Desktop
- Check that filters behave correctly
- Test with different screen sizes
Getting help and learning more
Built-in help: Both Desktop and Service have extensive help documentation. Don’t skip it.
Community resources: The Power BI community is incredibly helpful. Forums, YouTube channels, and local meetups are goldmines.
Local learning opportunities: Organizations like NEST Nepal often host Power BI workshops and training sessions. These are great places to learn alongside other developers and analysts in Nepal’s growing data science community.
The bottom line
You need both tools to be effective with Power BI in any business context. Desktop is your creative space; Service is your distribution platform.
Start with Desktop to learn the basics, then move to Service when you’re ready to share your work. Don’t try to do everything in one tool—they’re designed to work together, not replace each other.
Most importantly, don’t get overwhelmed by all the features. Start simple: connect to some data in Desktop, make a basic chart, publish to Service, and share with one colleague. Once that works, you can explore the advanced features.
The learning curve might seem steep initially, but once you understand how Desktop and Service complement each other, Power BI becomes an incredibly powerful tool for turning data into insights.