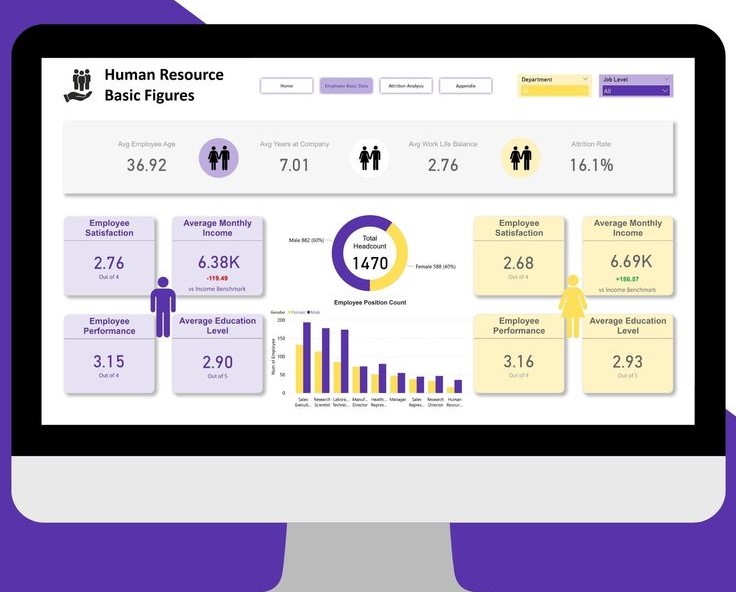
Gone are the days when HR departments relied solely on annual reviews and gut feelings to assess employee performance. Today’s HR teams are leveraging Power BI to create data-driven performance management systems that provide real-time insights, identify trends, and support better decision-making.

Let’s dive into how you can transform your HR analytics game with Power BI.
Why HR Teams Are Switching to Power BI
Traditional performance tracking methods are plagued with issues: they’re time-consuming, subjective, and often provide insights too late to be actionable. Power BI solves these problems by:
- Centralizing data from multiple HR systems into one dashboard
- Automating report generation to save hours of manual work
- Providing real-time insights instead of quarterly snapshots
- Enabling predictive analytics to identify at-risk employees early
- Creating standardized metrics across all departments and locations
Essential Performance Metrics to Track
Before building your Power BI dashboard, identify the metrics that truly matter for your organization. Here are the core performance indicators most HR teams focus on:
Individual Performance Metrics
- Goal completion rates – percentage of objectives met within timeframes
- Productivity scores – output quality and quantity measurements
- Skill development progress – training completion and certification tracking
- Peer feedback scores – 360-degree review ratings
- Attendance and punctuality – tardiness patterns and absence rates
Team Performance Metrics
- Team productivity trends – collective output measurements
- Collaboration effectiveness – cross-functional project success rates
- Knowledge sharing activity – mentoring and training participation
- Innovation metrics – ideas submitted and implemented
- Customer satisfaction scores – client feedback tied to specific teams
Organizational Performance Indicators
- Employee retention rates – turnover analysis by department
- Promotion velocity – time from hire to advancement
- Performance distribution – bell curve analysis across roles
- Engagement survey results – correlation with performance outcomes
- Diversity and inclusion metrics – performance equity analysis
Setting Up Your Data Sources
The foundation of effective HR analytics is clean, connected data. Here’s how to structure your data pipeline:
Primary Data Sources
HRIS (Human Resource Information System): Employee profiles, job histories, salary information, and organizational structure data.
Performance Management Systems: Goal tracking, review scores, feedback comments, and development plans.
Time Tracking Systems: Attendance data, project hours, overtime patterns, and productivity metrics.
Learning Management Systems: Training completion, certification achievements, and skill assessments.
Survey Platforms: Employee engagement surveys, pulse surveys, and exit interview data.
Data Connection Strategy
Start with your most reliable data source (usually your HRIS) and gradually add others. Use Power BI’s built-in connectors for common HR systems like:
- Workday – Direct API connection
- BambooHR – CSV export or API integration
- ADP – Scheduled data refresh setup
- Excel/Google Sheets – For smaller organizations or supplementary data
Building Your Performance Dashboard

Dashboard 1: Individual Performance Overview
This dashboard provides managers with a complete view of each employee’s performance:
Key Visualizations:
- Performance scorecards showing current ratings vs. targets
- Goal progress bars with completion percentages and deadlines
- Skill development timelines, tracking certification, and training progress
- Trend analysis comparing current performance to historical data
- Peer comparison charts showing relative performance within teams
Pro Tip: Use conditional formatting to highlight employees who need immediate attention with red indicators, while green shows top performers.
Dashboard 2: Team Performance Analytics
Designed for department heads and senior managers:
Core Components:
- Team productivity heatmaps showing performance across time periods
- Collaboration network diagrams revealing team dynamics
- Performance distribution charts identifying high and low performers
- Retention risk indicators based on performance and engagement data
- Resource allocation analysis showing workload distribution
Dashboard 3: Organizational Performance Insights
Executive-level dashboard for strategic decision-making:
Strategic Metrics:
- Company-wide performance trends with year-over-year comparisons
- Department performance rankings with contextual explanations
- Talent pipeline analysis showing promotion readiness
- ROI on training investments correlated with performance improvements
- Predictive analytics for turnover and performance risks
Implementation Walkthrough
Step 1: Data Preparation (Week 1)
- Audit your current data sources and identify gaps
- Clean and standardize data formats across all systems
- Create unique employee identifiers to link data across platforms
- Set up automated data refresh schedules to ensure current information
- Implement data governance policies for privacy and accuracy
Step 2: Basic Report Creation (Week 2-3)
- Start with simple employee profiles showing basic performance data
- Create goal tracking visualizations with progress indicators
- Build attendance and productivity reports for immediate value
- Add filtering capabilities by department, role, or time period
- Test with a small pilot group before full deployment
Step 3: Advanced Analytics (Week 4-6)
- Implement predictive models for turnover risk assessment
- Create a correlation analysis between training and performance
- Build comparative dashboards for peer benchmarking
- Add automated alerting for performance anomalies
- Integrate external data like market benchmarks or industry standards
Real-World Use Cases
Case Study 1: Sales Team Performance
A mid-sized software company used Power BI to track their sales team’s performance beyond just revenue numbers. They integrated CRM data with HR systems to monitor:
- Activity-based performance (calls made, meetings scheduled)
- Pipeline management effectiveness (conversion rates by stage)
- Customer relationship quality (feedback scores and retention)
- Skill development impact (training completion vs. performance improvement)
Result: 23% improvement in sales team performance within six months, with clear identification of top performers’ best practices.
Case Study 2: Manufacturing Floor Optimization
A manufacturing company implemented Power BI to track production employee performance:
- Safety incident correlation with productivity and training
- Equipment efficiency tied to operator performance
- Quality control metrics by individual and shift
- Continuous improvement suggestions, tracking, and implementation
Result: 15% reduction in safety incidents and 18% improvement in production quality scores.
Case Study 3: Remote Team Management
A consulting firm adapted its performance tracking for remote work:
- Client satisfaction scores linked to individual consultants
- Project delivery metrics tracking on-time completion
- Billable hours optimization, identifying efficiency patterns
- Professional development in virtual environments
Result: Maintained productivity levels during remote transition while improving client satisfaction by 12%.
Best Practices for HR Analytics
Data Privacy and Security
- Implement role-based access to ensure employees only see relevant data
- Anonymize sensitive information in aggregate reports
- Comply with GDPR/CCPA requirements for employee data handling
- Regular security audits of data access and usage patterns
Avoiding Common Pitfalls
- Don’t over-monitor – focus on meaningful metrics, not surveillance
- Balance quantitative and qualitative data for a complete picture
- Ensure data accuracy through regular validation and cleaning
- Communicate the purpose clearly to avoid employee resistance
Change Management
- Start with willing participants and expand gradually
- Provide comprehensive training on new performance metrics
- Show clear benefits to both managers and employees
- Regular feedback sessions to improve the system
Advanced Features to Explore
Predictive Analytics
Use Power BI’s AI capabilities to:
- Forecast turnover risk based on performance patterns
- Identify promotion candidates through skill and performance analysis
- Predict training needs before performance gaps emerge
- Optimize team composition based on collaboration data
Natural Language Queries
Enable managers to ask questions like:
- “Show me the top performers in the marketing department.”
- “Which employees completed cybersecurity training this quarter?”
- “How does Sarah’s performance compare to her peers?”
Mobile Integration
Create mobile-friendly dashboards for:
- On-the-go performance reviews during field visits
- Real-time team status updates for remote managers
- Quick access to employee information during meetings
- Instant performance alerts for urgent situations
Measuring ROI and Success
Track these metrics to demonstrate the value of your Power BI implementation:
Time Savings
- Reduced report generation time from hours to minutes
- Faster performance review cycles with automated data collection
- Streamlined decision-making through real-time insights
Improved Outcomes
- Higher employee retention through early intervention
- Better promotion decisions based on comprehensive data
- Increased productivity through targeted development programs
- Enhanced manager effectiveness with actionable insights
Cost Reduction
- Lower turnover costs through predictive analytics
- Optimized training investments based on performance correlation
- Reduced compliance risks through consistent tracking
- Improved resource allocation based on performance data
Getting Started: Your 30-Day Plan
Week 1: Foundation
- Install Power BI Desktop and complete basic tutorials
- Identify your primary data source and export sample data
- Create your first simple employee performance report
- Define key stakeholders and their information needs
Week 2: Expansion
- Connect additional data sources (attendance, training records)
- Build a basic dashboard with 3-4 key performance indicators
- Test with a small group of managers for feedback
- Refine based on the initial user experience
Week 3: Enhancement
- Add filtering and drill-down capabilities
- Implement automated data refresh schedules
- Create role-specific dashboard views
- Train additional users on basic functionality
Week 4: Optimization
- Analyze usage patterns and optimize frequently used reports
- Implement advanced features like conditional formatting
- Plan for scaling to additional departments or locations
- Document processes and create user guides
Conclusion
Power BI transforms HR from a reactive support function into a proactive strategic partner. By implementing systematic performance tracking, you’re not just measuring what happened – you’re predicting what will happen and taking action to improve outcomes.
The key to success is starting simple, focusing on actionable insights, and gradually building sophistication as your team becomes more comfortable with data-driven decision-making. Remember, the goal isn’t to create perfect dashboards – it’s to create better employee experiences and business outcomes through informed HR practices.
Start with one key metric, build confidence through quick wins, and expand your analytics capabilities as your organization matures. Your employees, managers, and executives will all benefit from the clarity and insights that Power BI brings to performance management.