


What Is a Dataset in Power BI?
In Power BI, a dataset is a collection of data that you import or connect to, then model and visualize through reports and dashboards.
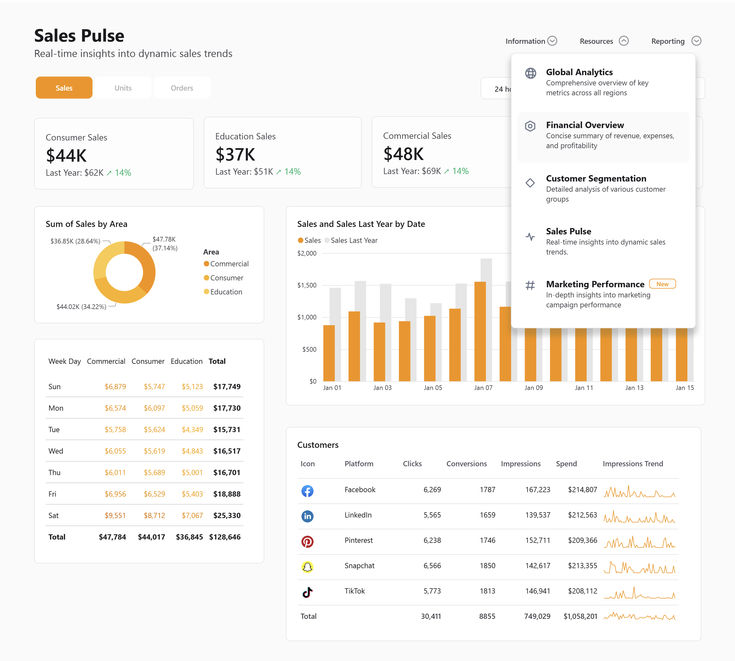
Think of it as the foundation: before you can build charts or dashboards, you need a dataset powering them.
A dataset can come from:
- Excel or CSV files
- SQL databases
- Google Analytics or web APIs
- Hosting logs (via cPanel or other systems)
- SharePoint, OneDrive, or cloud connectors
What You’ll Need
- A Windows 10 or 11 PC with Power BI Desktop installed
- Some sample data (Excel, CSV, or from a cloud source)
- An internet connection (if using live data like Google Sheets or SQL Online)
Optional: A Nest Nepal Power BI License if you want to publish to the cloud or collaborate.
Step 1: Launch Power BI Desktop
- Open Power BI Desktop
- On the Home screen, click Get Data
You’ll be presented with dozens of connectors, but let’s start with the most common.
Step 2: Connect to a Data Source
Option A: Import an Excel File
- Click Get Data > Excel
- Browse and select your .xlsx file
- Choose the worksheet or table you want to import
- Click Load or Transform Data to enter Power Query
Option B: Connect to a Database (e.g., MySQL)
- Click Get Data > More > Database > MySQL
- Enter:
- Server address
- Database name
- Credentials (use a read-only user for safety)
- Click Connect, then choose your tables
Tip: You can use hosting logs from Nest Nepal’s servers if MySQL logging is enabled!
Option C: Google Sheets (for Web Professionals)
- Go to Google Sheets → Share your sheet publicly (View access)
Copy the CSV export link: https://docs.google.com/spreadsheets/d/XYZ/export?format=csv
- In Power BI:
- Click Get Data > Web
- Paste the link
- Load data directly!
Step 3: Transform the Data (Optional But Powerful)
Now you’re inside Power Query Editor.
Use this to:
- Rename columns
- Filter rows (e.g., remove nulls)
- Merge or append tables
- Change data types (e.g., Date, Currency)
This step is key for data hygiene.
Example: Remove duplicate page visits, convert timestamps to a readable format, or calculate uptime percentage from logs.
Step 4: Model the Dataset (Set Relationships)
Once your data is loaded:
- Go to the Model View
- Drag and drop tables to create relationships
- Set cardinality (One-to-Many, Many-to-One)
- Configure relationships by matching keys (e.g., UserID in both tables)
This step helps Power BI understand how your tables relate, allowing for cross-filtering in visuals.
Step 5: Save & Publish Your Dataset
- Click File > Save As to save your .pbix project
- (Optional) Sign in to the Power BI account
- Click Publish > Select Workspace to upload to Power BI Service.
Now your dataset is live in the cloud, and you can create dashboards on PowerBI.com or share with others.
Advanced Use Cases
| Use Case | Data Source | Dataset Configuration |
| Hosting Analytics | cPanel log files | Import CSV, use date filters |
| Sales Reports | SQL or Excel | Create relationships between Sales, Products |
| Web Traffic | Google Analytics API | Connect via Web or GA Connector |
| CRM Dashboards | Zoho CRM API or HubSpot | Use custom connectors + API keys |
Common Errors & Fixes
| Error | Reason | Fix |
| Re-check the file path, or validate the data | Wrong path or invalid format | Use the correct DB user with proper access |
| Credentials error | Missing or incorrect login | Use correct DB user with proper access |
| Duplicate columns | Join tables with bad keys | Use Power Query to deduplicate |
| Web source failure | Wrong URL format | Use a CSV export or JSON endpoint |
Pro Tips for Nest Nepal Clients
- Create datasets with uptime, bandwidth, and traffic logs from cPanel or WHM
- Collaborate by publishing datasets to shared workspaces
- Use Power BI Pro to schedule refreshes every 15 minutes
- Secure your data with Row-Level Security (RLS) for different departments or clients
Conclusion: Why It Matters
Creating datasets is the first and arguably most important step in any Power BI project. With the right dataset, you can:
- Make better business decisions
- Monitor hosting/server performance
- Understand customer behavior
- Create stunning visual dashboards
By mastering this process, you unlock Power BI’s full potential.